Neue Charts erstellen/en: Unterschied zwischen den Versionen
Zur Navigation springen
Zur Suche springen
(Die Seite wurde neu angelegt: „Creating new Charts“) |
(Übernehme Bearbeitung einer neuen Version der Quellseite) |
||
| (10 dazwischenliegende Versionen von einem anderen Benutzer werden nicht angezeigt) | |||
| Zeile 2: | Zeile 2: | ||
<div class="et-screenshot"> | <div class="et-screenshot"> | ||
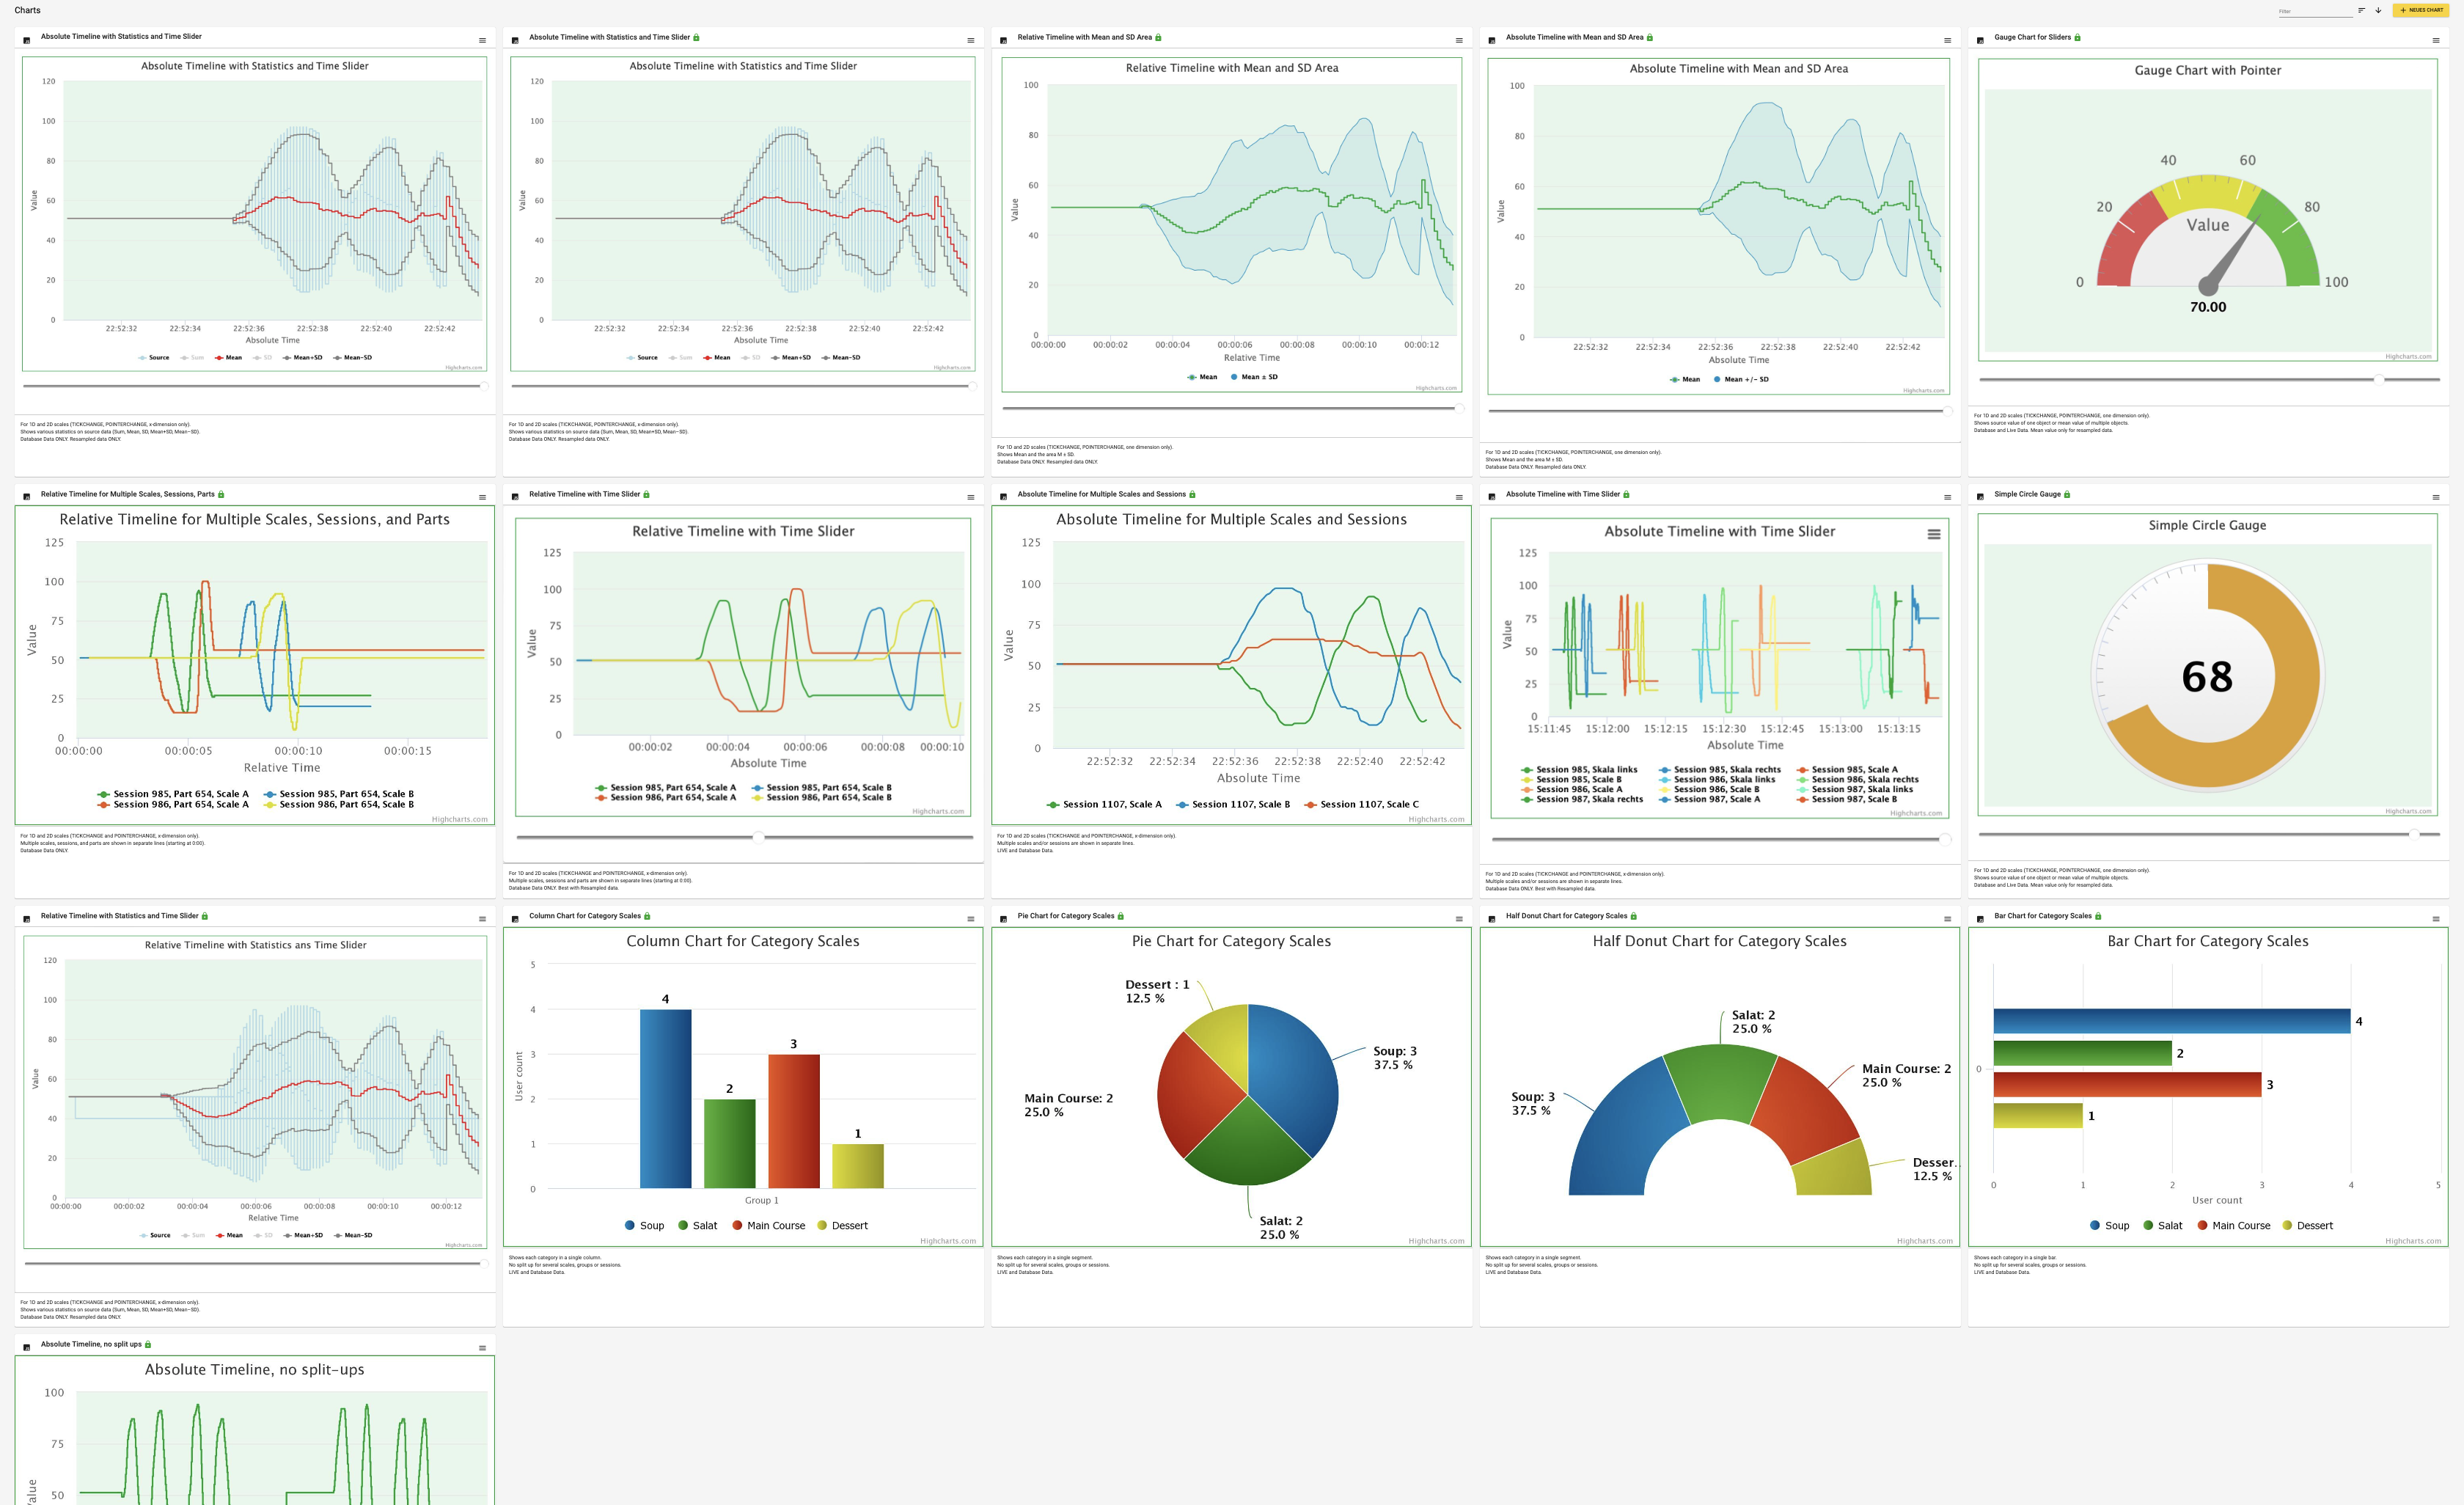
| − | [[Datei:DE- Übersicht der Charts.png| | + | [[Datei:DE- Übersicht der Charts.png|The main menu item "Charts"]] |
</div> | </div> | ||
| − | + | Explore the main menu item "Charts" in the Manager interface for an overview of all currently available Charts. | |
<div class="et-screenshot"> | <div class="et-screenshot"> | ||
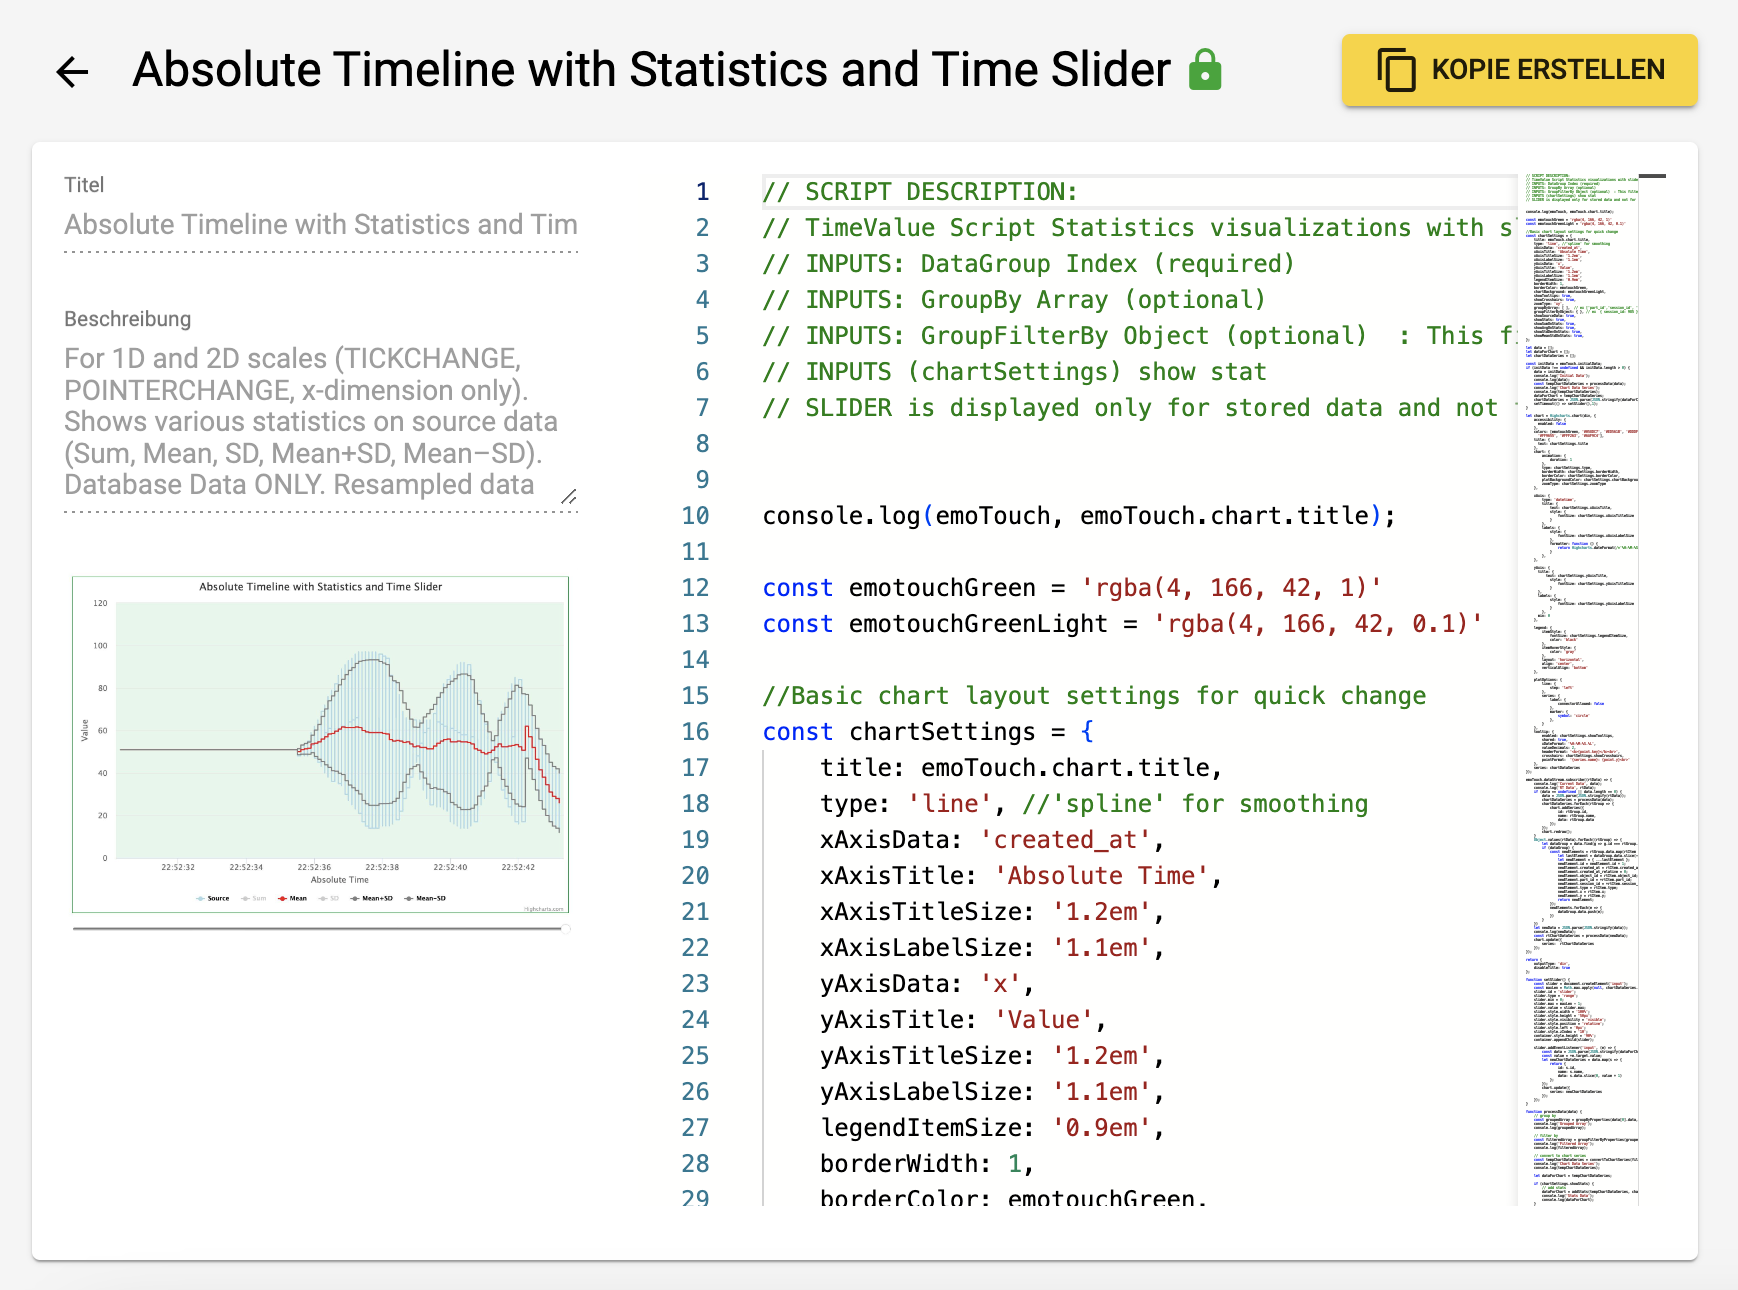
| − | [[Datei:DE - Chart Details einsehen.png|Chart | + | [[Datei:DE - Chart Details einsehen.png|View Chart details]] |
</div> | </div> | ||
| − | + | <div class="mw-translate-fuzzy"> | |
| + | Click on a Chart to browse through its details and complete script. You cannot edit the originals, but you can create copies and configure them according to your needs. | ||
| + | </div> | ||
<div class="et-screenshot"> | <div class="et-screenshot"> | ||
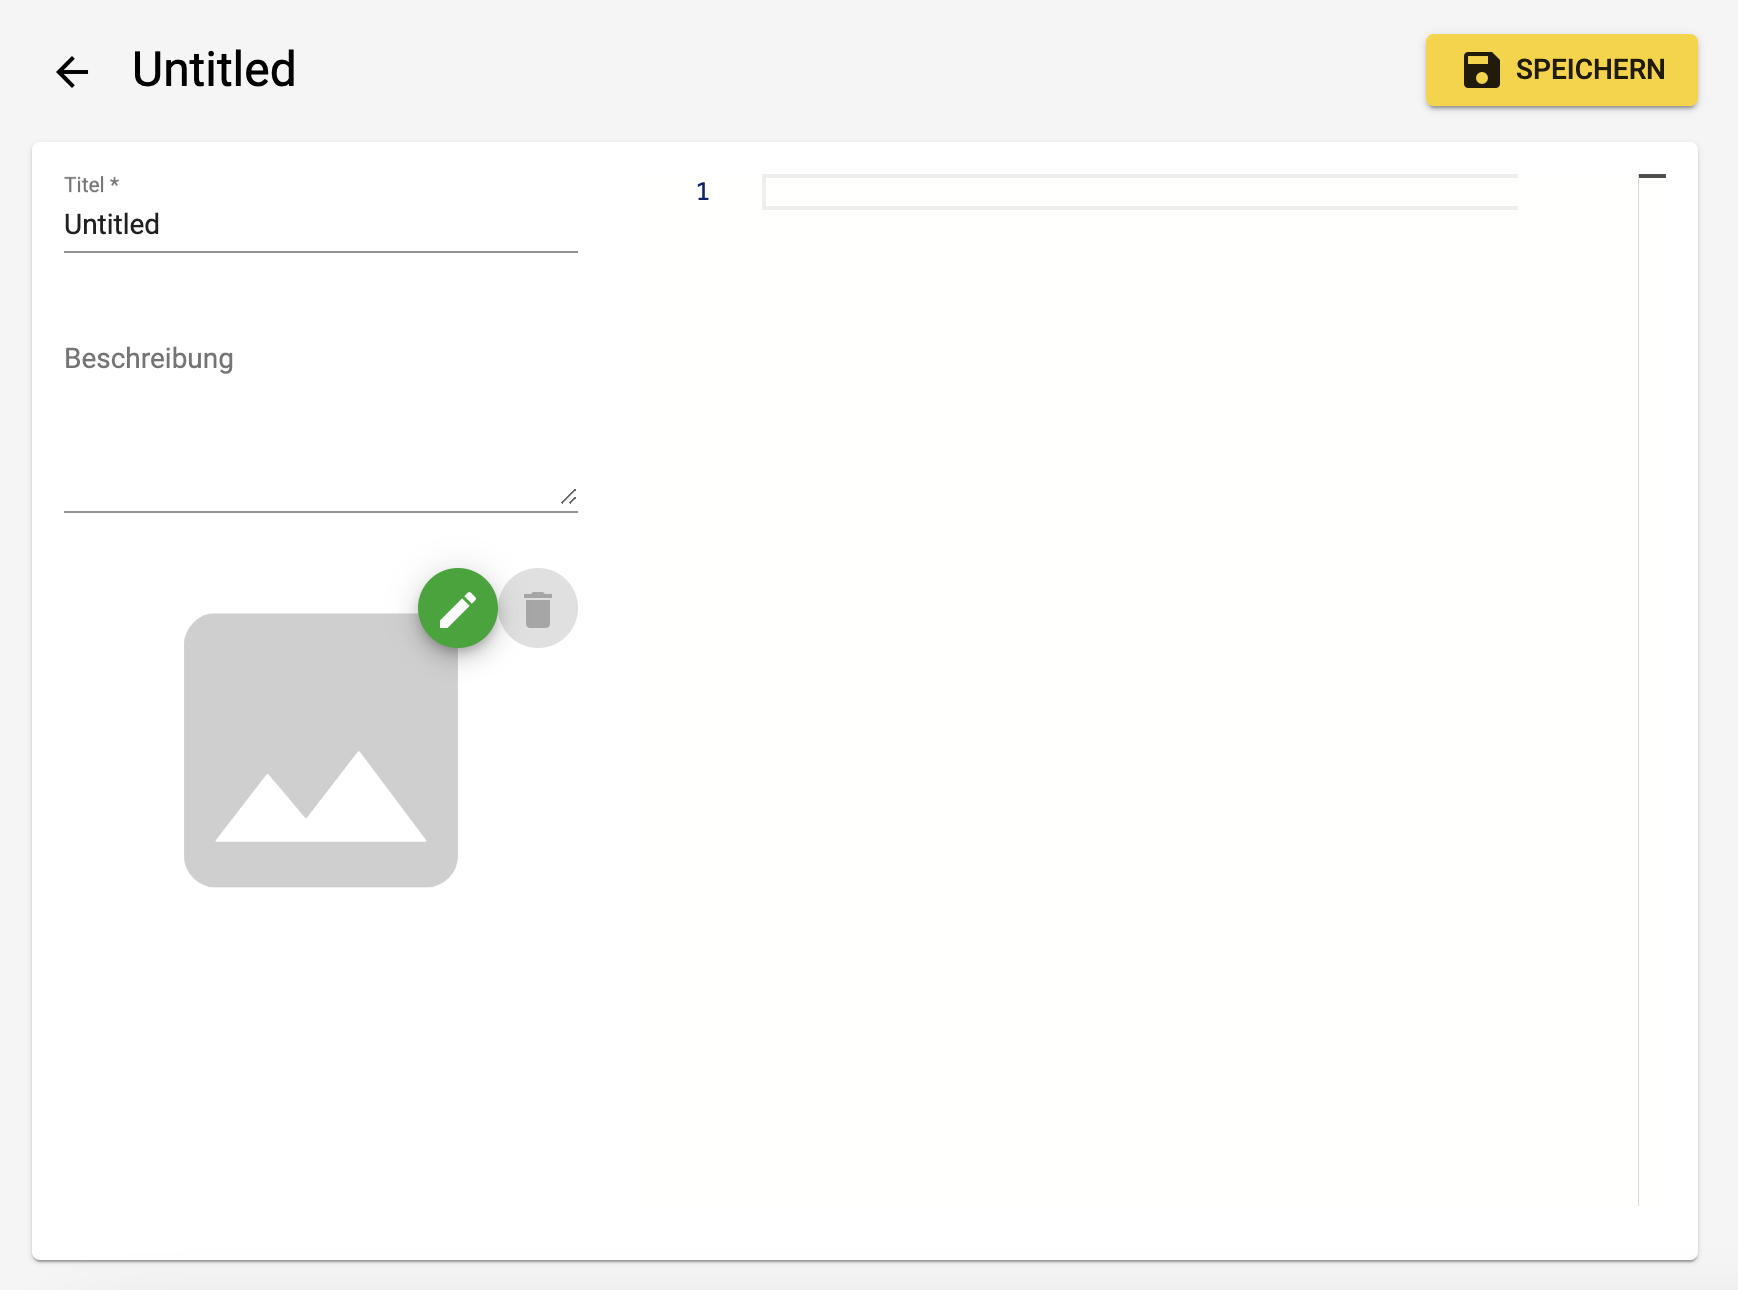
| − | [[Datei:DE - Neues Chart erstellen.png| | + | [[Datei:DE - Neues Chart erstellen.png|Creating a new Chart]] |
</div> | </div> | ||
| − | + | Creating your own Charts | |
| − | + | You have the option of using your own scripts for new Charts via the "+ NEW CHART" button. We recommend working with JAVA script for this. | |
| − | + | Make sure to save the new Chart manually, it will not be saved automatically. | |
| − | + | Your own Chart will now appear in the overview. In future versions, you will also be able to share your own Charts with other users. | |
Aktuelle Version vom 24. Oktober 2024, 10:33 Uhr
Explore the main menu item "Charts" in the Manager interface for an overview of all currently available Charts.
Click on a Chart to browse through its details and complete script. You cannot edit the originals, but you can create copies and configure them according to your needs.
Creating your own Charts
You have the option of using your own scripts for new Charts via the "+ NEW CHART" button. We recommend working with JAVA script for this.
Make sure to save the new Chart manually, it will not be saved automatically.
Your own Chart will now appear in the overview. In future versions, you will also be able to share your own Charts with other users.


