Charts hinzufügen und konfigurieren/en: Unterschied zwischen den Versionen
(Die Seite wurde neu angelegt: „The creation of charts is relatively complex and takes place in a dialogue window that adapts to the selections made. Follow the steps below to create a visual…“) |
(Die Seite wurde neu angelegt: „The tabs within the dialogue window are interdependent, i.e. they adapt to any settings previously made in other tabs. This makes the selection easier by usual…“) |
||
| Zeile 5: | Zeile 5: | ||
The creation of charts is relatively complex and takes place in a dialogue window that adapts to the selections made. Follow the steps below to create a visualisation according to your requirements. | The creation of charts is relatively complex and takes place in a dialogue window that adapts to the selections made. Follow the steps below to create a visualisation according to your requirements. | ||
| − | + | The tabs within the dialogue window are interdependent, i.e. they adapt to any settings previously made in other tabs. This makes the selection easier by usually avoiding selection paradoxes. | |
Version vom 11. Februar 2024, 18:03 Uhr
The "Edit Chart" window
The creation of charts is relatively complex and takes place in a dialogue window that adapts to the selections made. Follow the steps below to create a visualisation according to your requirements.
The tabs within the dialogue window are interdependent, i.e. they adapt to any settings previously made in other tabs. This makes the selection easier by usually avoiding selection paradoxes.
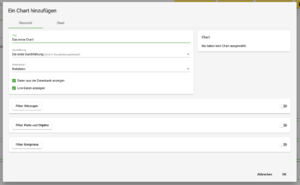
Übersicht: Treffen Sie zunächst eine Wahl des Titels, der Durchführung die dargestellt werden soll und der Resampling rate. Hier können auch Rohdaten zur Darstellung ausgewählt werden. Achten Sie darauf, dass Sie das Resampling mit der gewünschten Rate zuvor bereits für die entsprechende Durchführung erstellt haben. Zu Beginn sind nur zwei Reiter sichtbar: Übersicht und Chart. Sobald ein Chart ausgewählt ist, erscheint auf der Übersichtsseite eine Vorschau. Weitere Reiter erscheinen bei der Aktivierung weiterer Filter.
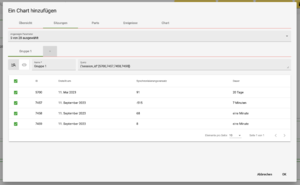
Sitzungen: Wählen Sie aus, welche Details unten in der Sessionübersicht angezeigt werden sollen. Der Query String kann zukünftig bei Bedarf manuell erstellt und konfiguriert werden. Wählen Sie ggf. einzelne Sessions, die Sie darstellen wollen, oder aktivieren Sie alle Sessions dieser Durchführung
Parts & Objekte: Links: Auflistung aller Parts in dem Projekt. Rechts: Auflistung aller (interaktiven) Objekte im Part. Wählen Sie einen Part aus, so werden zunächst automatisch sämtliche Objekte des Parts mit ausgewählt. Streben Sie ausschließlich die Visualisierung der Ereignisse des Parts selbst (Sitzungsereignisse) an, wählen Sie alle Objekte wieder ab und lassen Sie den Part markiert.
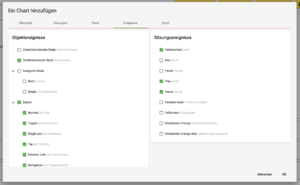
Events/ Ereignisse: Im nächsten Schritt wählen Sie aus, welche konkreten Ereignisse (Event-Typen), die von den Objekten oder Parts erzeugt wurden, dargestellt werden sollen. Links: Objektereignisse: Aufgeführt sind die Objekte und die jeweiligen Namen der events die sie erzeugen Rechts: Sitzungsereignisse: Aufgeführt sind die Eventtypen, sowie deren offizielle Bezeichnung)
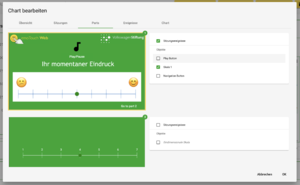
Chart: Aus den Möglichkeiten ist eine Art der Visualisierung (ein Chart) auszuwählen. Bestätigen Sie mit OK


Hilfe: Wenn das Chart Interface leer bleibt
Haben Sie alle obengenannten Schritte befolgt, doch die Darstellung im Chart Interface bleibt leer, so könnte es an einem der folgenden Umstände liegen.
- Möglicherweise haben Sie die Darstellung auf ein bestimmtes Objekt beschränkt, welches von den Teilnehmenden nicht verwendet wurde. Dementsprechend erzeugt es keine Daten und somit stellt es auch keine dar. Probieren Sie, die Filter auf andere Objekte zu erweitern.
- Nicht jedes Chartdesign eignet sich sich für die Darstellung aller Datentypen. Barcharts zum Beispiel können ausschließlich Kategorieskalen abbilden, keine Slider. Wählt man einen ungeeigneten Datentypen für das Chart, führt dies in der Regel zu einem leeren Feld im Chart Interface
Für eine Übersicht und Datemempfehlung für die Charts klicken Sie hier