Charts hinzufügen und konfigurieren/en: Unterschied zwischen den Versionen
(Die Seite wurde neu angelegt: „* Not every Chart design is suitable for displaying all data types. Bar charts, for example, can solely display category scales, not sliders. If you select an…“) |
(Die Seite wurde neu angelegt: „For an overview and recommended dates for the charts click here.“) |
||
| Zeile 32: | Zeile 32: | ||
* Not every Chart design is suitable for displaying all data types. Bar charts, for example, can solely display category scales, not sliders. If you select an unsuitable data type for the Chart, this usually results in an empty field in the Chart Interface. | * Not every Chart design is suitable for displaying all data types. Bar charts, for example, can solely display category scales, not sliders. If you select an unsuitable data type for the Chart, this usually results in an empty field in the Chart Interface. | ||
| − | + | For an overview and recommended dates for the charts click [[here]]. | |
Version vom 11. Februar 2024, 20:00 Uhr
The "Edit Chart" window
The creation of charts is relatively complex and takes place in a dialogue window that adapts to the selections made. Follow the steps below to create a visualisation according to your requirements.
The tabs within the dialogue window are interdependent, i.e. they adapt to any settings previously made in other tabs. This makes the selection easier by usually avoiding selection paradoxes.
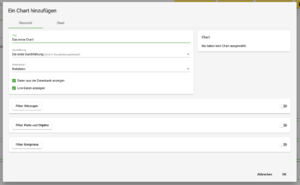
Overview: First select the title, the realisation to be displayed and the resampling rate. Raw data can also be selected for display here. Make sure that you have already created the resampling with the desired rate for the corresponding realisation in advance. Initially, only two tabs are visible: "Overview" and "Chart". As soon as a Chart is selected, a preview appears on the overview page. Further tabs appear when additional filters are activated.
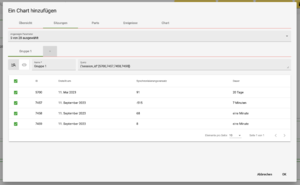
Sessions: Select which details should be displayed at the bottom of the session overview. The query string will be manually creatable and configureble in future versions. If necessary, select individual sessions that you want to display or activate all sessions for this realisation.
Parts & Objects: Left: List of all parts in the project. Right: List of all (interactive) objects within the part. If you select a part, initially, all objects within the part will be selected automatically. If you want to visualise nothing but the events of the part itself (session events), deselect all objects manually and leave the part selected.
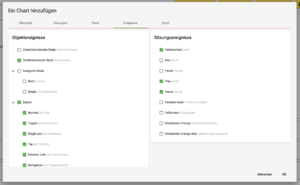
Events: In the next step, select which particular events (event types) generated by the objects or parts are to be displayed. Left: Object events: The objects and the respective names of the events they generate are listed. Right: Session events: The list shows the event types and their official names.
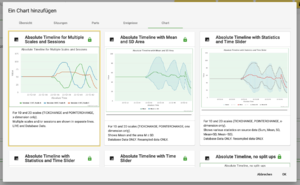
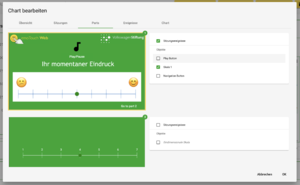
Chart: Select a type of visualisation (a Chart) from the listed options. Confirm with OK.


Help: If the chart interface stays blank
If you have followed all aforementioned steps but the display in the Chart Interface remains blank, this could be due to one of the following circumstances.
- You may have restricted the visualisation to a specific object that was not interacted with by the participants. Accordingly, it does not generate any data and therefore does not display any. Try extending the filters to other objects.
- Not every Chart design is suitable for displaying all data types. Bar charts, for example, can solely display category scales, not sliders. If you select an unsuitable data type for the Chart, this usually results in an empty field in the Chart Interface.
For an overview and recommended dates for the charts click here.