Adding and editing Charts
The "Edit Chart" window
The creation of charts is relatively complex and takes place in a dialogue window that adapts to the selections made. Follow the steps below to create a visualisation according to your requirements.
The tabs within the dialogue window are interdependent, i.e. they adapt to any settings previously made in other tabs. This makes the selection easier by usually avoiding selection paradoxes.
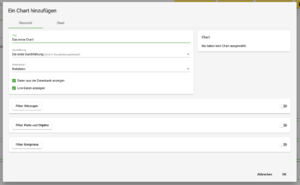
Overview: First select the title, the realisation to be displayed and the resampling rate. Raw data can also be selected for display here. Make sure that you have already created the resampling with the desired rate for the corresponding realisation in advance. Initially, only two tabs are visible: "Overview" and "Chart". As soon as a Chart is selected, a preview appears on the overview page. Further tabs appear when additional filters are activated.
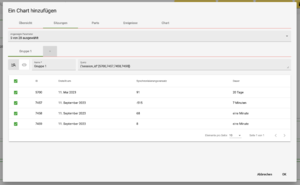
Sessions: Select which details should be displayed at the bottom of the session overview. The query string will be manually creatable and configureble in future versions. If necessary, select individual sessions that you want to display or activate all sessions for this realisation.
Parts & Objects: Left: List of all parts in the project. Right: List of all (interactive) objects within the part. If you select a part, initially, all objects within the part will be selected automatically. If you want to visualise nothing but the events of the part itself (session events), deselect all objects manually and leave the part selected.
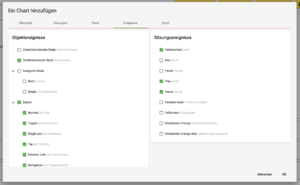
Events/ Ereignisse: Im nächsten Schritt wählen Sie aus, welche konkreten Ereignisse (Event-Typen), die von den Objekten oder Parts erzeugt wurden, dargestellt werden sollen. Links: Objektereignisse: Aufgeführt sind die Objekte und die jeweiligen Namen der events die sie erzeugen Rechts: Sitzungsereignisse: Aufgeführt sind die Eventtypen, sowie deren offizielle Bezeichnung)
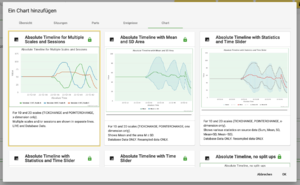
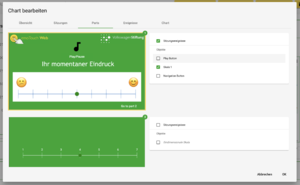
Chart: Aus den Möglichkeiten ist eine Art der Visualisierung (ein Chart) auszuwählen. Bestätigen Sie mit OK


Hilfe: Wenn das Chart Interface leer bleibt
Haben Sie alle obengenannten Schritte befolgt, doch die Darstellung im Chart Interface bleibt leer, so könnte es an einem der folgenden Umstände liegen.
- Möglicherweise haben Sie die Darstellung auf ein bestimmtes Objekt beschränkt, welches von den Teilnehmenden nicht verwendet wurde. Dementsprechend erzeugt es keine Daten und somit stellt es auch keine dar. Probieren Sie, die Filter auf andere Objekte zu erweitern.
- Nicht jedes Chartdesign eignet sich sich für die Darstellung aller Datentypen. Barcharts zum Beispiel können ausschließlich Kategorieskalen abbilden, keine Slider. Wählt man einen ungeeigneten Datentypen für das Chart, führt dies in der Regel zu einem leeren Feld im Chart Interface
Für eine Übersicht und Datemempfehlung für die Charts klicken Sie hier