History of the Interface
The following text is taken from Carolin Scholle's bachelor thesis: Vom Drehschalter zum Multitouch. Das iPad als musikpsychologisches Forschungsinterface, Osnabrück 2012.
Existing interfaces to the two-dimensional emotion space
After Russel presented his Circumplex Model of Affect in 1980, it was a long time before this was used in a digital interface. In the mid-1990s, the EmotionSpace Lab developed the first version of a two-dimensional emotion space (2DES) on the computer screen. Since then, a number of improvements and variants have come into circulation that are significantly more powerful due to technological developments. This chapter presents each of the existing interfaces, drawing largely on the summary by Kopiez et al. (2011).
EmotionSpace Lab

EmotionSpace Lab (ESL) was developed in 1996 by Australian music psychologist Emery Schubert and is the first program to use 2DES. The control works with the mouse. Smileys for clarification are provided at each end of the axes, and visual stimuli can be shown next to the emotion space. In addition to the cursor, the horizontal position is visualized at the bottom left, as shown in Figure 3.1. The axes are scaled equally, valence is indicated horizontally, and activity is indicated vertically. Possible stimuli are words and pictures in addition to audio files, which are displayed next to the 2DES (Kopiez et al. 2011, p. 132f.). The ESL uses a sample rate of 2 Hz, or two samples per second. This was justified by the fact that changes in activity estimation in response to volume changes occurred only 1-3 seconds after the acoustic event. According to the Nyquist-Shannon sampling theorem (Benson 2007, p. 254f.), the sample rate must be at least twice as high as the expected frequency of the signal, i.e. two samples per second, in order to be able to evaluate with second precision (Schubert 2010, p. 225).
The two-dimensional CRDI

The Continuous Response Digital Interface (CRDI) was developed in the late 1980s and provides information about music based on a dimension. There is the variant as a pointer disk, as shown in Figure 3.2 - the rotary switch at the beginning of the development of digital interfaces for capturing emotions - or as a box with a lever or slider. If two-dimensional data are to be collected with the CRDI, it is possible to use two devices simultaneously (Kopiez et al. 2011, pp. 73-77). The two-dimensional CRDI used by Madsen in 1997 and 1998 functions similarly to the ESL in that it displays two dimensions simultaneously on a computer screen (Kopiez et al. 2011, p. 134f.).
Feeltrace

The Feeltrace restricts the 2DES, which was always rectangular until now, to a circular area. Various emotions are arranged around the circle, such as furious, delighted, etc. Stimuli and emotion space are not presented here within one program. The control is done as usual with the mouse. In addition, this interface offers user feedback, in which not only a cursor is visualized, but a circle is displayed at the current mouse position, the color of which depends on the position in the system. For positive valence it is colored green, for negative red, high activity yellow and low blue. Mixed colors are formed between the outermost points at the ends of the axes where each of these colors occur purely. In addition to the colors, there is temporal feedback in that the previous mouse positions persist as circles, gradually becoming smaller and finally disappearing. This creates the impression of a moving worm - a concept adopted by the interfaces developed later (Kopiez et al. 2011, pp. 136-138).
EMuJoy

EMuJoy is the abbreviation for the interface Emotion measurement while listening to Music using a Joystick. The software was developed in 2007 by Frederik Nagel and is a further development of the ESL. EMuJoy offers the possibility to use both acoustic and visual stimuli or both at the same time. Pictures can be shown in a slideshow with a certain time each, with or without pauses in between. For movies, images and sound can also be shown separately (Nagel 2007, p. 35f.). The 2DES takes up the whole screen, can be operated with joystick or mouse and offers a worm like the Feeltrace as optional visualization. Instead of the visualization with colors, a smiley in place of the mouse pointer, which adjusts its facial expression to the position in the coordinate system, provides user feedback. Along the valence axis, the corner of the mouth changes and the eye size increases with increasing activity. Chills are additionally captured via mouse click (Kopiez et al. 2011, pp. 138-141). Further advantages of EMuJoy compared to its predecessors are platform independence, since the program is Java-based, and control via the Internet, so that test subjects can participate in examinations at home in front of their own computers. In addition, there is a remote control, so that starting, stopping as well as selecting the stimuli is made possible during the course of the experiment (Nagel 2007, p. 33f.). Nagel uses a sampling rate of 1/50ms, so that the data can be evaluated up to 10 Hz. A high sampling rate is advantageous for the synchronization of stimulus and the recorded data. One might think that since emotions change far more slowly, such a high sampling rate would be unnecessary, but nevertheless, self-reports can change very quickly and one might lose valuable data, e.g., the fast path from one corner to the other (Nagel 2007, p. 32f.).
RTCRR
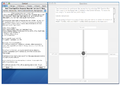
Figure 3.5: RTCRR - The two main windows (Schubert 2012, p. 139).
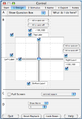
Figure 3.6: RTCRR - Options window, tab for visual settings (Schubert 2012, p. 140)
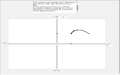
Figure 3.7: RTCRR - Question window during use (Schubert 2012, p. 140)
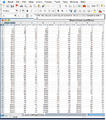
Figure 3.8: RTCRR - output format (Schubert 2012, p. 142).


Real Time Cognitive Response Recording (RTCRR, "Arti-car") is Schubert's own development of ESL, but completely reprogrammed to be usable under MAC OS X 10. The interface is very much designed for flexibility and there are many settings for both the visual display and the export of the results. It offers the option to use one or both axes, to label the axes with different terms (see Figure 3.6) and furthermore an improvement of the sample rate and the output format. The position in the 2DES is indicated along the axes with two sliders, the mouse pointer is optionally visualized with the common worm in variable length. All audio and multimedia formats supported by Quicktime can be used as stimuli. Movies are displayed in the upper left corner of the "Question" window. After the measurement, where data is saved in an internal format, can be exported in desired sample rate between 1 and 30 Hz, so that an output format usable for a statistics program of choice is created as in Figure 3.8. However, when the beta version was released in 2007, the maximum sample rate of 30 Hz was a rather theoretical value that was severely limited by computer performance and use of feedback options, especially the worm. It is explained how a test run can be used to find out what the approximate maximum sampling rate is (Schubert 2012). This indicates that the program internally collects the data event-based and does not read the position of the mouse at intervals of a certain time.
pARF

The Portable Audience Response Facility is designed to record audience responses during a performance. It works in one or two dimensions and is operated with a stylus and touch screen. One emotion is displayed per quadrant: angry, joyous, depressed and peaceful. It has been used in contemporary dance performances (Kopiez et al. 2011, pp.147-148). In this process, the results are time-stamped and can be synchronized. There is no possibility to play back stimuli via the device itself (Stevens, Vincs, and Schubert 2009).
Comparison of the interfaces
The interfaces have the common goal to let subjects indicate emotions in real time and to be able to synchronize the results with a specific stimulus. Differences between the interfaces are some functions and the interface. According to Kopiez et al. understanding the 2DES is not a big problem for the subjects, there just needs to be a short lead time to practice categorizing. In general, this type of survey requires little verbalization ability on the part of the subjects. The authors conclude that EMuJoy is currently the best software implementation. Important arguments for this are the platform independence (e.g. ESL/RTCRR only on Mac systems), high sampling rate and flexibility regarding the stimuli, which do not even necessarily have to be selected before the start of the experiment, but can also be adapted to the subject's reactions. It is intuitive in that it takes up the entire screen and the stimuli are displayed in the background of the coordinate cross. However, the smiley and worm could be distracting or obscure portions of the image. The RTCRR is also rated as positive, but has the disadvantage that per stimulus the program must be copied to produce a usable output file. In contrast to EMuJoy, however, it has a play button in the examination window so that the subject can start the stimulus himself and thus give it his full attention from the beginning (Kopiez et al. 2011, pp. 149-152). This conclusion can be agreed with as far as it goes. EMuJoy seems to be superior to RTCRR, which was developed in the same year, and all other interfaces no longer correspond to the current state of technical development. EMuJoy distinguishes itself mainly through the more intuitive visualization. Compare, for example, the feedback worm on the respective screenshots (see Figure 3.4 and Figure 3.7). pARF stands out due to the mobile application option, but offers a poorer visual appearance and cannot play music.
Round and rectangular emotion space
In addition to considering independent valence and activation values, the two-dimensional emotion space allows the distance of the point from the coordinate origin to be interpreted as emotion intensity. Kopiez et al. (2011) refer to emotion intensity as a dimension and both the evaluation of the coordinates based on their x and y components and the direction (of the angle) as an analysis of emotion quality. These designations seem to be unfortunate, as the distance from the coordinate origin is not a third, independent dimension, but merely a reinterpretation. A point in the coordinate system is thereby defined by polar coordinate form, i.e., by the two "dimensions" distance from the origin (emotion intensity) and angle between the line connecting the point with the origin and the x-axis (emotion quality). An analysis of x and y coordinates should also allow both qualitative (e.g., ratio of x and y values) and quantitative evaluation (e.g., using the individual dimensions). An examination of the two individual components is quite common and refers to quantity, not only quality (cf. chapter 4). Depending on which of the two ways of interpretation should be the focus of the evaluation, the interface should be chosen. If one would like to interpret the data from a series of experiments with the 2DES with regard to emotion intensities, the restriction to the circle as with the Feeltrace offers advantages. With a rectangular model, different maximum intensities can be specified for different angles because, for example, the upper right corner is farther from the origin than the outermost point on the x-axis at the right edge of the screen. One would have to decide whether to calculate with absolute distances to the origin or relative distances with respect to the maximum possible distance at a given angle with the x-axis (cf. Kopiez et al. 2011, p. 153f.). Conversely, a problem arises with the circular emotion space when evaluating the individual components valence or activity: Can a positive emotion contain less arousal than one that is neutral with respect to valence?
Control
The interfaces presented use computer mouse, joystick or a stylus in conjunction with a touch screen as possible input devices. Control with a joystick offers two possibilities: In Nagel's case, the joystick position indicates the pointer position in the 2DES, taking advantage of the fact that one automatically moves back to the zero point. It is also possible that the joystick position corresponds to the movement speed and direction or the acceleration. Thus, if one moves the joystick towards the zero point, the pointer stays where it is and does not move to the zero point as well (Kopiez et al. 2011, p. 154f.). Whether mouse or joystick mediates better between test person, their desired position and the way to get there is certainly also related to personal experience with one or the other input device. Someone who has never used a joystick before may cope better with the mouse, even though the joystick may be more intuitive to use. The use of a touchscreen, however, makes it possible to dispense with this mediation completely and select the point directly in the image. Especially for subjects who are less used to using computers, this can help to reduce the barrier of the interface and prevent biased results to some extent. An interface for the iPad could be superior to the pARF in that the touchscreen is large enough to no longer require a stylus as an aid.
Output formats
As an interim conclusion, Kopiez et al. state that the use of two dimensions to capture emotion is universally perceived as useful, however, the subtle differences between the individual models do not allow for a comparison of the data collected with them (Kopiez et al. 2011, p. 155f.). The output files are also not directly comparable, but precise information on the formats is lacking.
Sources
- Scholle, Carolin (2012). Vom Drehschalter zum Multitouch. Das iPad als musikpsychologisches Forschungsinterface. Bachelorthesis University of Osnabrück.
- Kopiez, Reinhard, Jessika Dressel, Marco Lehmann und Friedrich Platz (2011). Vom Sentographen zur Gänsehautkamera: Entwicklungsgeschichte und Systematik elektronischer Interfaces in der Musikpsychologie. Tectum-Verl.
- Benson, David J. (2007). Music: A Mathematical Offering. Cambridge University Press.
- Schubert, Emery (2010). „Continuous self-report methods“. In: Handbook of Music and Emotion. Hrsg. von Patrik N. Juslin und John A. Sloboda. Oxford University Press. Kap. 9, S. 223–253.
- Nagel, Frederik (2007). „Psychoacoustical and Psychophysiological Correlates of the Emotional Impact and the Perception of Music“. Diss. Hannover University of Music und Drama.
- Schubert, Emery. Real Time Cognitive Response Recording. url: http://marcs.uws.edu.au/links/ICoMusic/ArchiveCD/Full_Paper_PDF/Schubert_2.pdf (besucht am 29. 10. 2012).
- Stevens, Catherine, Kim Vincs und Emery Schubert (2009). „Measuring audience response on-line: an evaluation of the portable audience response facility (pARF)“. In: The Second International Conference on Music Communication Science.