Creating and editing Visualisations
Zur Navigation springen
Zur Suche springen
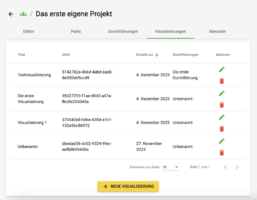
For an overview of all visualisations so far created for a particular project, and to create new ones, navigate to the "Visualisations" tab within a project.
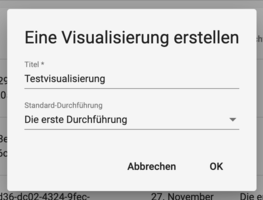
Use the corresponding button to create a new visualisation. Next to the title, first select which realisation is to be visualised. It is currently only possible to visualise the data from a single realisation at a time.
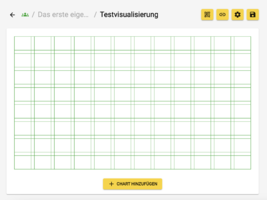
You will be forwarded directly to the grid view. Within the grid, add as many charts as you like and configure their size and position.


- Create a QR code that leads directly to the Chart Interface, i.e. to the immediate view of the charts.
- Or navigate to the Chart Interface yourself to view the visualisations.
- Use these settings to edit only the visualisation (e.g. the selected realisation) or the size of the grid, not the Charts themselves.
- Save your changes regularly! They are not saved automatically.
- The Charts themselves are edited via the "=" menu within the Chart preview.
- Add as many Charts to the grid as you like. Read more about this in the instructions for Charts.